₹100 became ₹1,201. This is what the journey felt like.
The honest version of our momentum backtest grew 12 times in 12½ years. Along the way it fell 49%, lost money in 4 years, and spent long stretches below its old high. That is where plans get abandoned.
The most common reaction to our survivorship-bias note was to the end result: ₹100 became ₹1,201 in 12½ years. That is what equities can do over a long run. Here is what the same honest backtest looked like along the way.
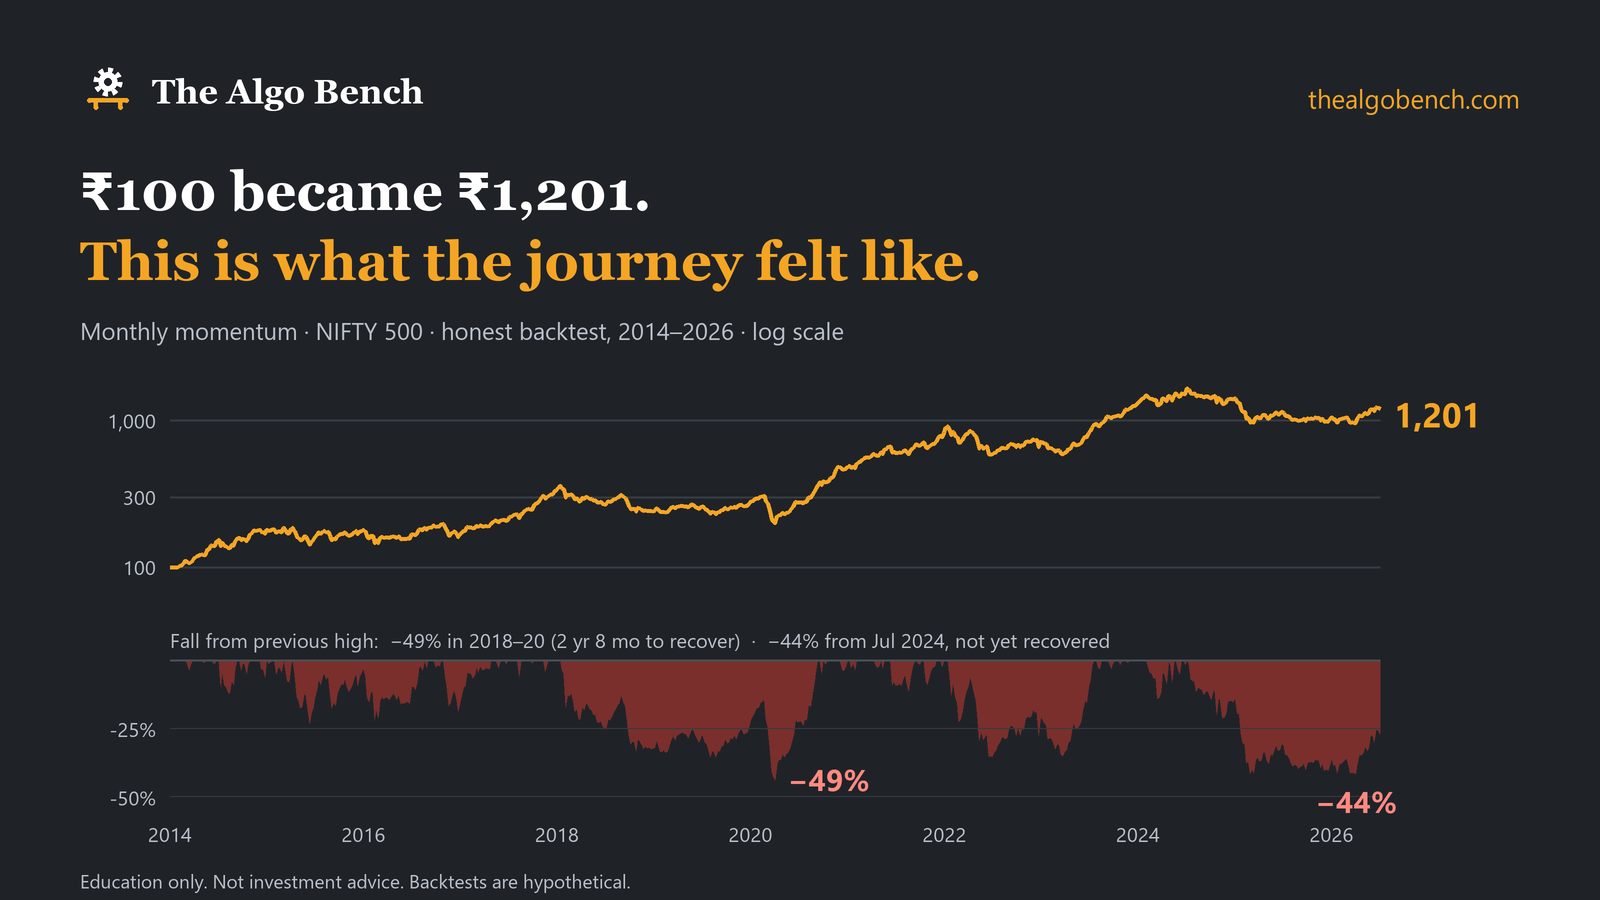
- −49% from its January 2018 high, and 2 years 8 months before it got back above it.
- A loss in 4 of the 12 years, including −27% in 2025, a year when the NIFTY 500 rose 7%.
- −44% from its July 2024 high, and still below that high when the data ends in July 2026.
Where plans break
On paper, the plan says “stay the course”. In a real fall, it is easy to find reasons to sell, to “wait for clarity”, or to skip the next rebalance. A fall of 10% or more in a few weeks can erase months of gains, and that is when the temptation is strongest.
The return in a backtest belongs only to someone who followed every rule, in the bad months too.
What rules and automation change
Write the plan while you are calm, and let the rules, ideally automated, carry it out when you are not. Fewer decisions in the heat of the moment, and nothing waiting on you to act.
An honest caveat: automation doesn’t remove the pain. The drawdown still happens. What it removes is the daily temptation to intervene. The one decision left, keeping the system switched on, is still yours.
The strategy behind the chart, with its full rules, costs and year-by-year results: Monthly momentum.
Was this useful?
More to say, or spotted a mistake? Write to [email protected]. We read everything.